
Jacksonville, FL housing market
The latest available asking prices, rents, and inventory, with monthly and yearly trends. Figures describe DoorHunter’s sampled listings in this region, not every home in the city.
Market data as of November 9, 2026
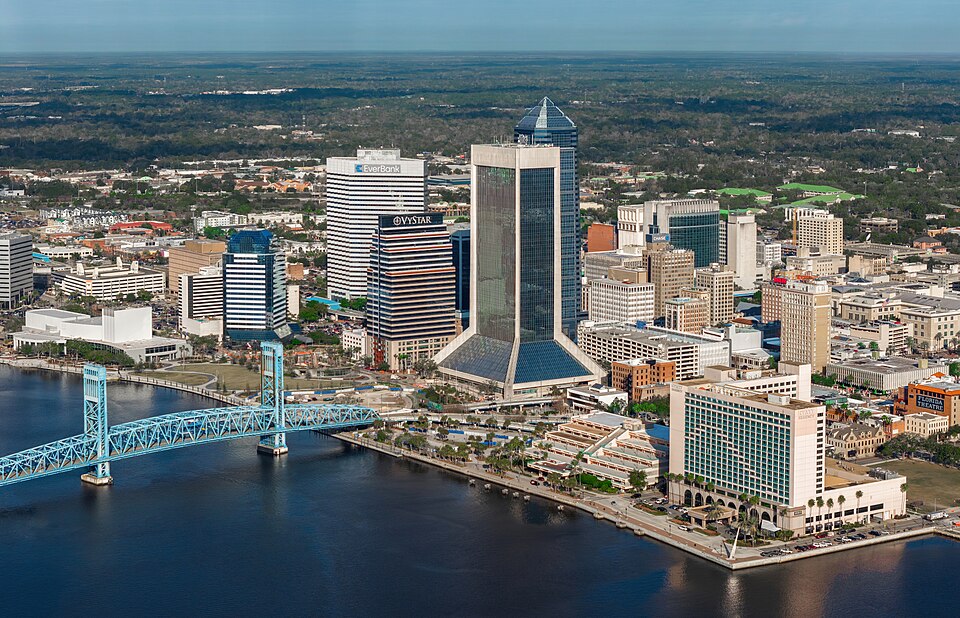 Photo credits · CC BY 4.0
Latest figures & market trends
Latest available listing data as of November 9, 2026. Figures update as new source data arrives.
| Metric | Latest |
|---|---|
| Median asking price | $348,985 |
| Median monthly rent | $1,850 |
| For-sale listings | 7,720 |
| Rental listings | 3,552 |
Monthly trends
Scroll the graph sideways to see every month.
View monthly history
| Month | Asking price | Monthly rent | For sale | Rentals | Est. cap rate |
|---|---|---|---|---|---|
| October 2026 | $349,900 | $1,850 | 7,383 | 3,249 | 4.51% |
| September 2026 | $350,000 | $1,850 | 4,837 | 3,187 | 5.13% |
| August 2026 | $337,174 | $1,850 | 3,605 | 2,849 | 4.60% |
Up to 12 recent months. Each month uses its last available observation, rather than a monthly average. Missing periods and changes in collection scope stay unavailable; the listing mix can still affect comparisons.
Explore by ZIP code
Find the areas that fit your investment approach. Hover to compare; select a ZIP to see its current figures and trends.
Loading ZIP boundaries…
Boundaries: 2020 Census ZIP Code Tabulation Areas, approximations of postal ZIPs. Statistics cover captured listings inside the configured market, which may include only part of a ZIP.
How investment potential is compared
The balanced score weights percentiles within the current listing sample: 50% higher estimated gross rental yield, 25% lower median asking price, and 25% shorter median days on market. Ties receive the same rank. Only ZIPs with at least 5 usable listings for every component are compared; at least two must qualify. This sample floor does not establish statistical confidence.
Listing age is a liquidity proxy, not completed-sale speed. Scores compare this market and date only; they do not measure future returns, neighborhood quality, appreciation, or risk. Individual metric colors use the same relative ranking, with higher yield, lower price, or shorter listing age receiving greener colors.
Gross yields use each for-sale property's modeled monthly rent × 12 ÷ asking price, before expenses or financing. Price and asking-rent medians come from separate listing cohorts.
Compare ZIP statistics
| ZIP code | Potential | Asking price | Monthly rent | Est. gross yield | Listing age |
|---|---|---|---|---|---|
| 89 / 100 | $199,000n = 186 | $1,320n = 153 | 9.30%n = 171 | 61 daysn = 81 | |
| 87 / 100 | $159,700n = 150 | $1,328n = 110 | 10.88%n = 146 | 72 daysn = 81 | |
| 86 / 100 | $254,900n = 355 | $1,650n = 238 | 8.27%n = 323 | 59 daysn = 169 | |
| 86 / 100 | $132,750n = 360 | $1,225n = 312 | 11.63%n = 349 | 74 daysn = 232 | |
| 83 / 100 | $269,990n = 149 | $1,695n = 102 | 7.95%n = 139 | 56 daysn = 71 | |
| 78 / 100 | $171,000n = 284 | $1,325n = 223 | 10.35%n = 271 | 83 daysn = 191 | |
| 72 / 100 | $280,000n = 327 | $1,810n = 267 | 8.06%n = 309 | 75 daysn = 172 | |
| 70 / 100 | $320,000n = 208 | $1,980n = 138 | 7.67%n = 187 | 65 daysn = 92 | |
| 68 / 100 | $325,000n = 119 | $1,971n = 62 | 7.65%n = 101 | 64 daysn = 53 | |
| 65 / 100 | $289,444n = 22 | Unavailablen = 0 | 9.29%n = 18 | 373 daysn = 8 | |
| 63 / 100 | $333,000n = 76 | $2,250n = 5 | 8.45%n = 28 | 93 daysn = 24 | |
| 61 / 100 | $399,999n = 53 | $1,825n = 5 | 7.99%n = 7 | 73 daysn = 9 |
Showing the entire market in the current figures and trends.
The market at a glance
Explore market trendsAsking rent by bedroom count
Compare the monthly rent of different home sizes.
Captured listing inventory
See the available sale and rental listing samples.
Current listing & rental details
Seven views of the region, with source coverage kept visible. Unavailable figures stay unavailable.
Purchase prices
Asking prices for active sale listings. The middle 50% range runs from the 25th to 75th percentile.
- Median listing priceSample: 7,700 listings
- $348,985
- Middle 50% asking-price range
- $260,000 to $490,000
- Median price per square footSample: 7,685 listings
- $192.90 / sq ft
Rental prices
Asking rents from a separate active rental cohort. Bedroom groups include only listings with a usable bedroom count.
- Median monthly asking rentSample: 3,547 listings
- $1,850
- Middle 50% rent range
- $1,445 to $2,202
- Median monthly rent per square footSample: 3,460 listings
- $1.25 / sq ft
- Studio / 1 bedroom
- $1,000
- 2 bedrooms
- $1,300
- 3 bedrooms
- $1,800
- 4 bedrooms
- $2,199
- 5+ bedrooms
- $2,784
Rental yields
Gross yield and cap rate use paired asking prices and modeled rents for sale listings. Cap rate deducts modeled operating expenses before financing and capital reserves.
- Median estimated cap rateSample: 6,420 listings
- 4.56%
- Median estimated gross rental yieldSample: 6,420 listings
- 7.58%
- Monthly rent-to-price ratio
- 0.53%
Inventory
Counts reflect captured active listings within this region.
- Active for-sale listings
- 7,720
- Active rental listings
- 3,552
Listing age
Listing age among active for-sale listings with a usable days-on-market value. This is not time to a completed sale.
- Median days on marketSample: 2,973 listings
- 80 days
- Share listed more than 30 days
- 79.01%
- Share listed more than 60 days
- 58.93%
- Share listed more than 90 days
- 44.37%
Sales activity
Captured sales are a partial sample of transactions. Months of supply divides active sale listings by captured sales in the last 30 days; zero sales cannot establish supply.
- Captured sales, last 30 days
- 993
- Captured sales, last 90 days
- 3,920
- Median sale price, last 90 daysSample: 3,920 listings
- $325,000
- Estimated months of supply
- 7.77 months
- 30-day absorption rate
- 12.86%
Underwriting scenarios
Medians of individual for-sale property scenarios using each listing’s own asking price and rent estimate. These are modeled results, not observed investment returns.
- Median modeled monthly cash flowSample: 6,420 listings
- -$687
- Middle 50% cash-flow range
- -$1,118 to -$359
- Median modeled cash-on-cash return
- -11.50%
- Median debt-service coverage
- 0.68×
- Median break-even occupancy
- 128.38%
- Share with positive modeled cash flow
- 10.28%
Scenario assumptions: 20.00% down; 7.50% fixed interest for 30 years; 2.00% closing costs; 5.00% of scheduled rent for capital reserves. Management 10.00%, maintenance 5.00%, and vacancy 5.00% of scheduled rent; annual taxes and insurance 1.50% of asking price. No HOA, rehab, or appreciation is assumed. Break-even occupancy above 100% indicates the scenario cannot cover costs at the modeled rent.
Income, employment & housing
Economic data have not been published for this market yet.
How to read these numbers
Price and rent reflect distinct listing cohorts rather than paired properties. Modeled yields and cap rates apply standard operating expense baselines and exclude individual financing, income taxes, and future capital expenditures.
Compare published markets
Current published markets with the closest median asking prices, ordered by proportional price difference. This is a price comparison, not a ranking of investment quality:
- Lakeland, FL· $349,000 median listing price · $1,900 median monthly rent
- Harrisburg, PA· $349,900 median listing price · $1,650 median monthly rent
- Greensboro, NC· $350,000 median listing price · $1,795 median monthly rent
- Columbus, OH· $345,000 median listing price · $2,000 median monthly rent
- Kyle, TX· $345,000 median listing price · $1,995 median monthly rent
What these medians mean for a rental budget
The price and rent medians describe different listings. Combining them below is a hypothetical sensitivity exercise, not a representative property, observed return, or recommendation.
Using the latest available listing figures, with source data as of November 9, 2026.
At a $348,985 purchase and $1,850 monthly rent, assume 25% down, a 7.5% fixed mortgage for 30 years, 5% vacancy, operating costs equal to 30% of scheduled rent, and a separate 5% capital reserve. These expense and financing assumptions are illustrative, not measured local costs.
- Rent collected after vacancy
- $1,758
- Operating costs
- $555
- Capital reserve
- $93
- Monthly principal and interest
- $1,830
- Illustrative monthly cash flow
- -$720
Replace the teaching assumptions with actual taxes, insurance, HOA fees, maintenance, vacancy, and loan terms in the rental property cash flow calculator. This example excludes income taxes, appreciation, and acquisition costs.
Local research for Jacksonville, FL
Review the parcel’s zoning and permitted use with Jacksonville Development Services before assuming a conversion, additional unit, or rental use. Evaluate renovation scope and property-specific insurance costs rather than transferring citywide averages into the budget.
Jacksonville zoning section and property use resources
Official resource checked October 6, 2026. Confirm current requirements with the governing jurisdiction before underwriting a property.
Read the complete data methodology · Understand cap rate and cash-on-cash return
Explore individual properties
Sign in to use the deal finder and review current listings with property-level underwriting.
View active deals