Akron, OH
1,020 listings for sale- Median asking price
- $214,900
- Monthly rent
- $1,250
- Rent-to-price ratio
- 0.58%
- Estimated cap rate
- 10.48%
- Days on market
- 45
Find and analyze cash-flowing rental properties. Compare tracked listings using your financing assumptions and return targets.
One free market. All markets with premium, including a 14-day trial.
Compare asking prices, rents, and estimated cap rates across supported markets.
108 of 108 markets
Set purchase criteria, financing assumptions, and minimum returns. DoorHunter compares tracked listings against your buy box.
7 of 42 examples match
Loading the property map…
Review rent estimates, comparables, loan payments, and projected cash flow.
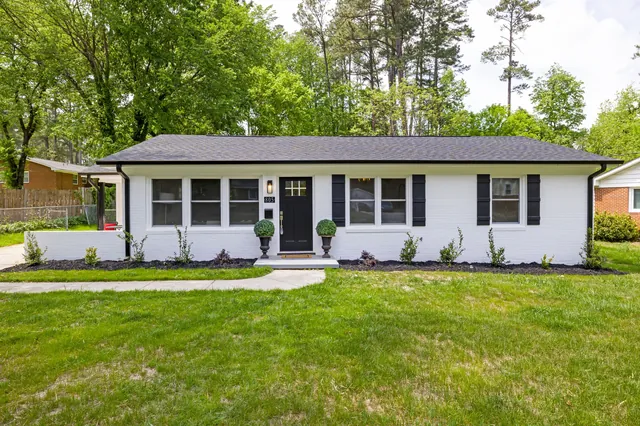
Austin, TX 78704
3 beds · 2 baths · 1,850 sq ft · Built 1984
$285,000Matches your buy box
Review projections, comparables, and market data using your assumptions.
Income, expenses, loan payoff and equity, modeled together.
| Projection | Year 1 | Year 10 | Year 30 |
|---|---|---|---|
| Annual cash flow | $3K | $9K | $31K |
| Loan balance | $211K | $179K | $0 |
| Equity | $126K | $262K | $796K |
Illustrative rental and sold examples show how comparables support estimates.
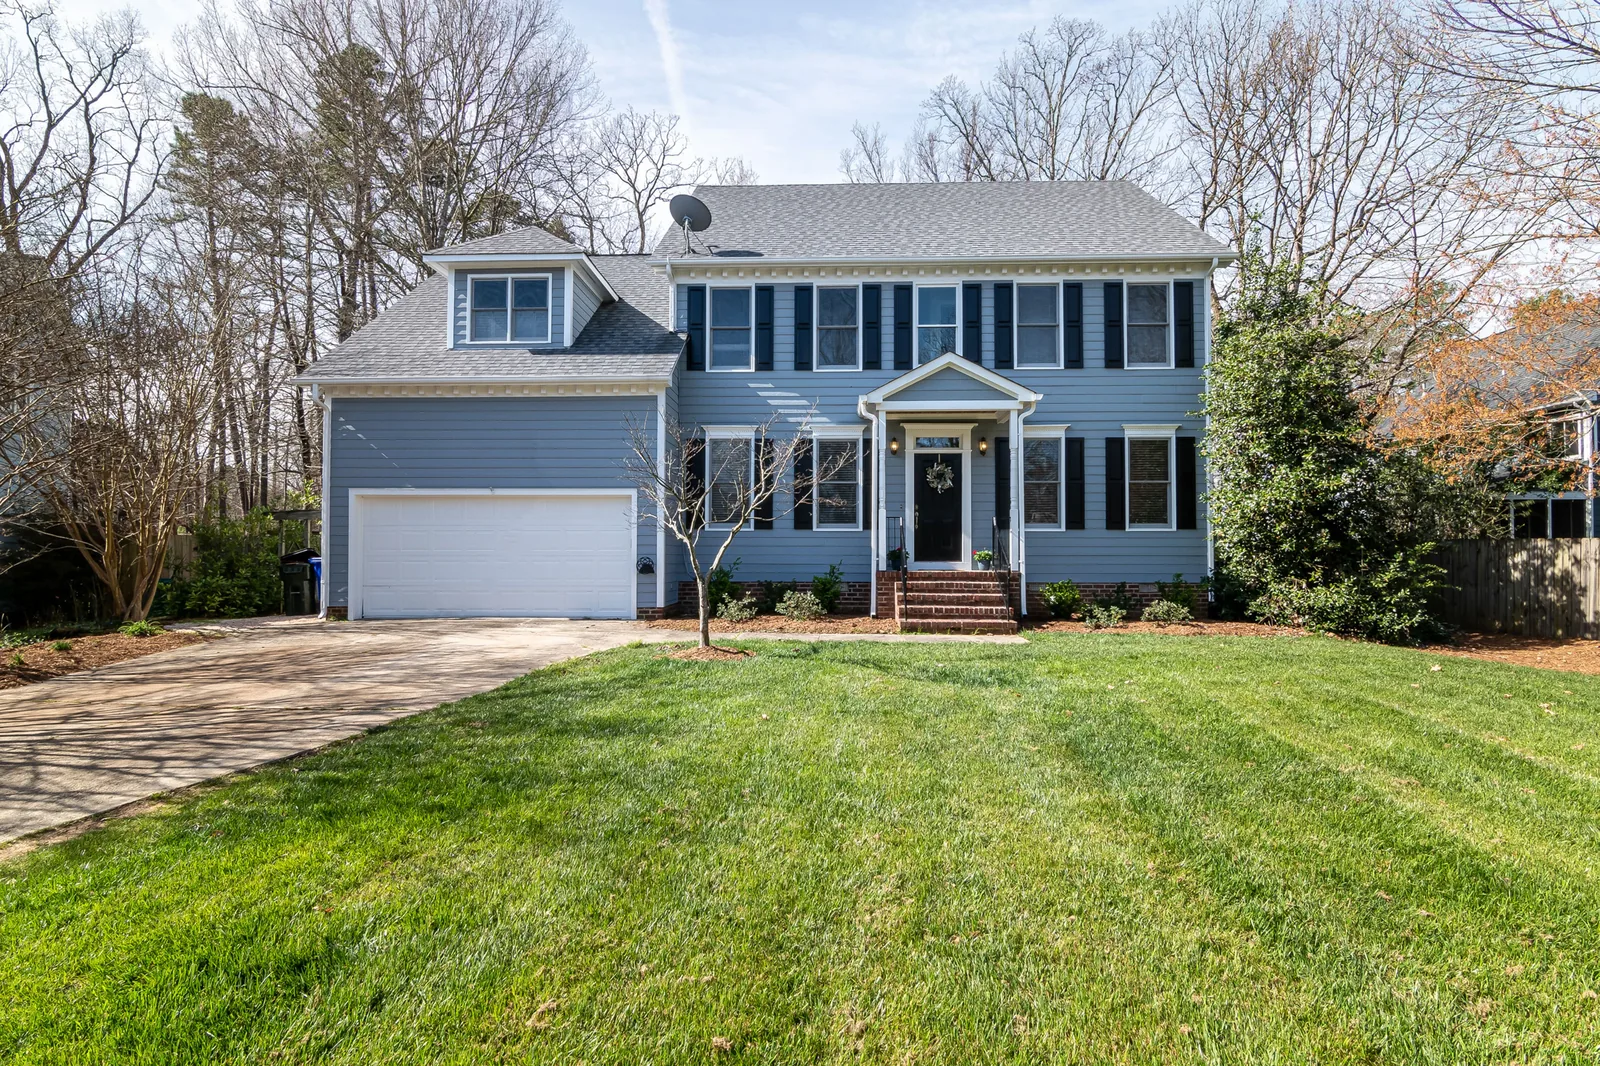 Rental comp$2,500/mo
2408 Live Oak St
1,820 sq ft · 0.20 mi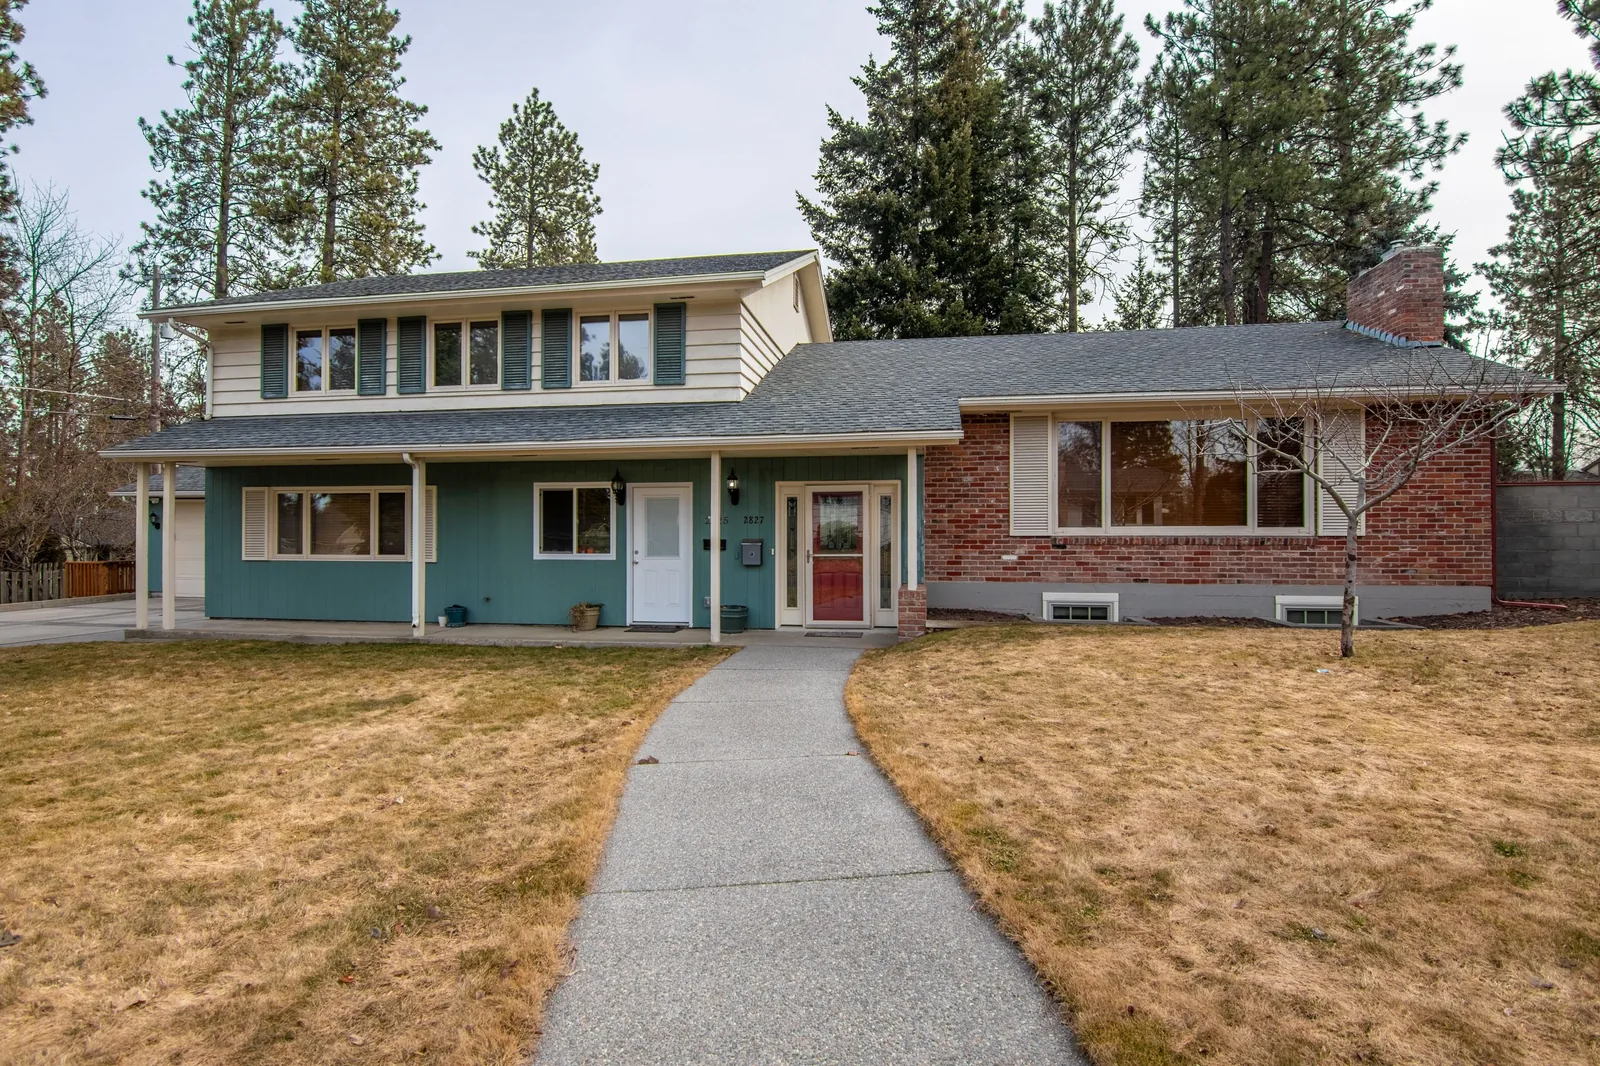 Recently sold$298,000
2410 Live Oak St
1,820 sq ft · 0.25 miCompare rent and value with an illustrative market snapshot.
Compare projected equity and cash flow with a hypothetical index investment.
Compare a wider mix of illustrative homes from across the map.
Find properties that meet your criteria.
Compare tracked listings using your buy box with premium.
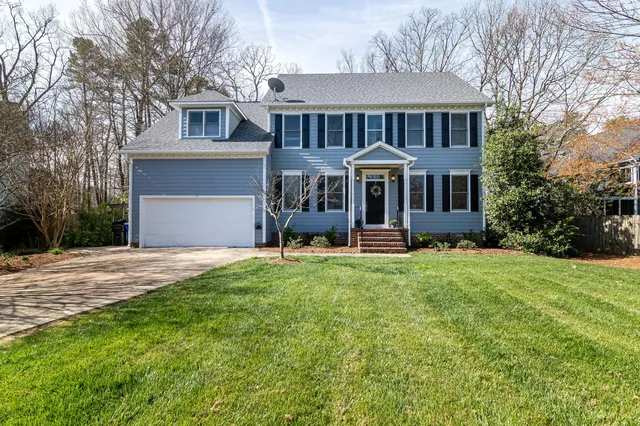
Review cash flow and comparables
beside the listing.
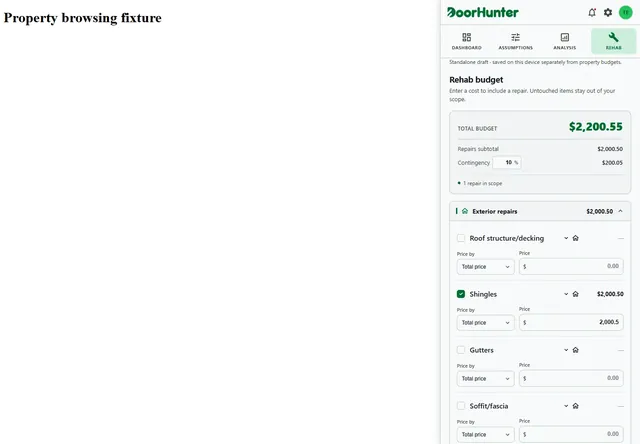
Review estimated cash flow, cap rate, and rent beside Zillow listings with the DoorHunter Chrome extension.
Adjust financing, edit rehab budgets, and save properties to your dashboard.
Create free accountOne membership. Web + Chrome extension included.
Model Buy & Hold, BRRRR, Fix & Flip, STR, and detailed rehab budgets with our free standalone calculators.
Free. No account or paid membership required.
Build your investing foundation for free. With Premium, find your next opportunity across 100+ markets, analyze listings as you browse, and find deals before your competition.
Your first market. Your tools to get started.
$0 / month
Free account with no time limit. No card required.
Create free accountMore markets. More opportunities. Your full investing toolkit.
$25.00/ month after trial
14-day free trial with your first premium subscription.
Try premiumPremium for web + Chrome. Cancel renewal anytime.
Explore 1 randomly selected market with a fixed map, download 1 PDF per day, use the investment calculators, access free learning resources, and plan rehab budgets. Your saved work is retained if premium ends.
Premium gives you access to all 100+ markets, analysis beside listings with the Chrome extension, and 10 free PDF generations per day. All calculators, learning resources, and rehab planning tools from Free are included.
Your first premium subscription includes a 14-day free trial, whether you subscribe at signup or upgrade from free later. The trial starts when you complete subscription checkout.
Monthly billing starts after your premium trial unless you cancel renewal before it ends. Returning subscribers who have already used their trial are billed at checkout.
Cancel renewal in Subscription & billing. Paid access continues through the paid period.
See the supported markets section above for active coverage. Coverage varies by market and listing source.
Your free market is randomly assigned once when your account is created and stays with your account. Upgrade to premium to explore other markets.